Mar 8 • Jordan Felber
How to Create a Site Analysis Diagram for Landscape Design (Step by Step)
Related — Landscape Design Foundations Course
A site analysis diagram is one of the first tools landscape designers use to understand the conditions of a property before beginning the design process.
Rather than immediately drawing patios, planting beds, or circulation paths, designers study the site itself and document how it behaves.
A site analysis diagram translates environmental information into a clear visual format that reveals opportunities and constraints across the landscape. Sun exposure, prevailing wind, drainage patterns, slope, and views are often mapped during this early stage of landscape site analysis.
By organizing these observations into diagrams, designers gain a deeper understanding of how a site functions throughout the day and across seasons. This information becomes the foundation for design decisions that follow.
In this guide you will learn what a site analysis diagram is, what information should be included, how to perform a landscape site study, and how designers create these diagrams using tools such as AutoCAD or Rhino.
What Is a Site Analysis Diagram
A site analysis diagram is a visual study that documents environmental and physical conditions affecting a property before design begins. Instead of illustrating finished design elements, the diagram focuses on understanding the existing site. This process is commonly taught in landscape architecture site analysis courses where students learn to evaluate environmental forces before proposing any design intervention.
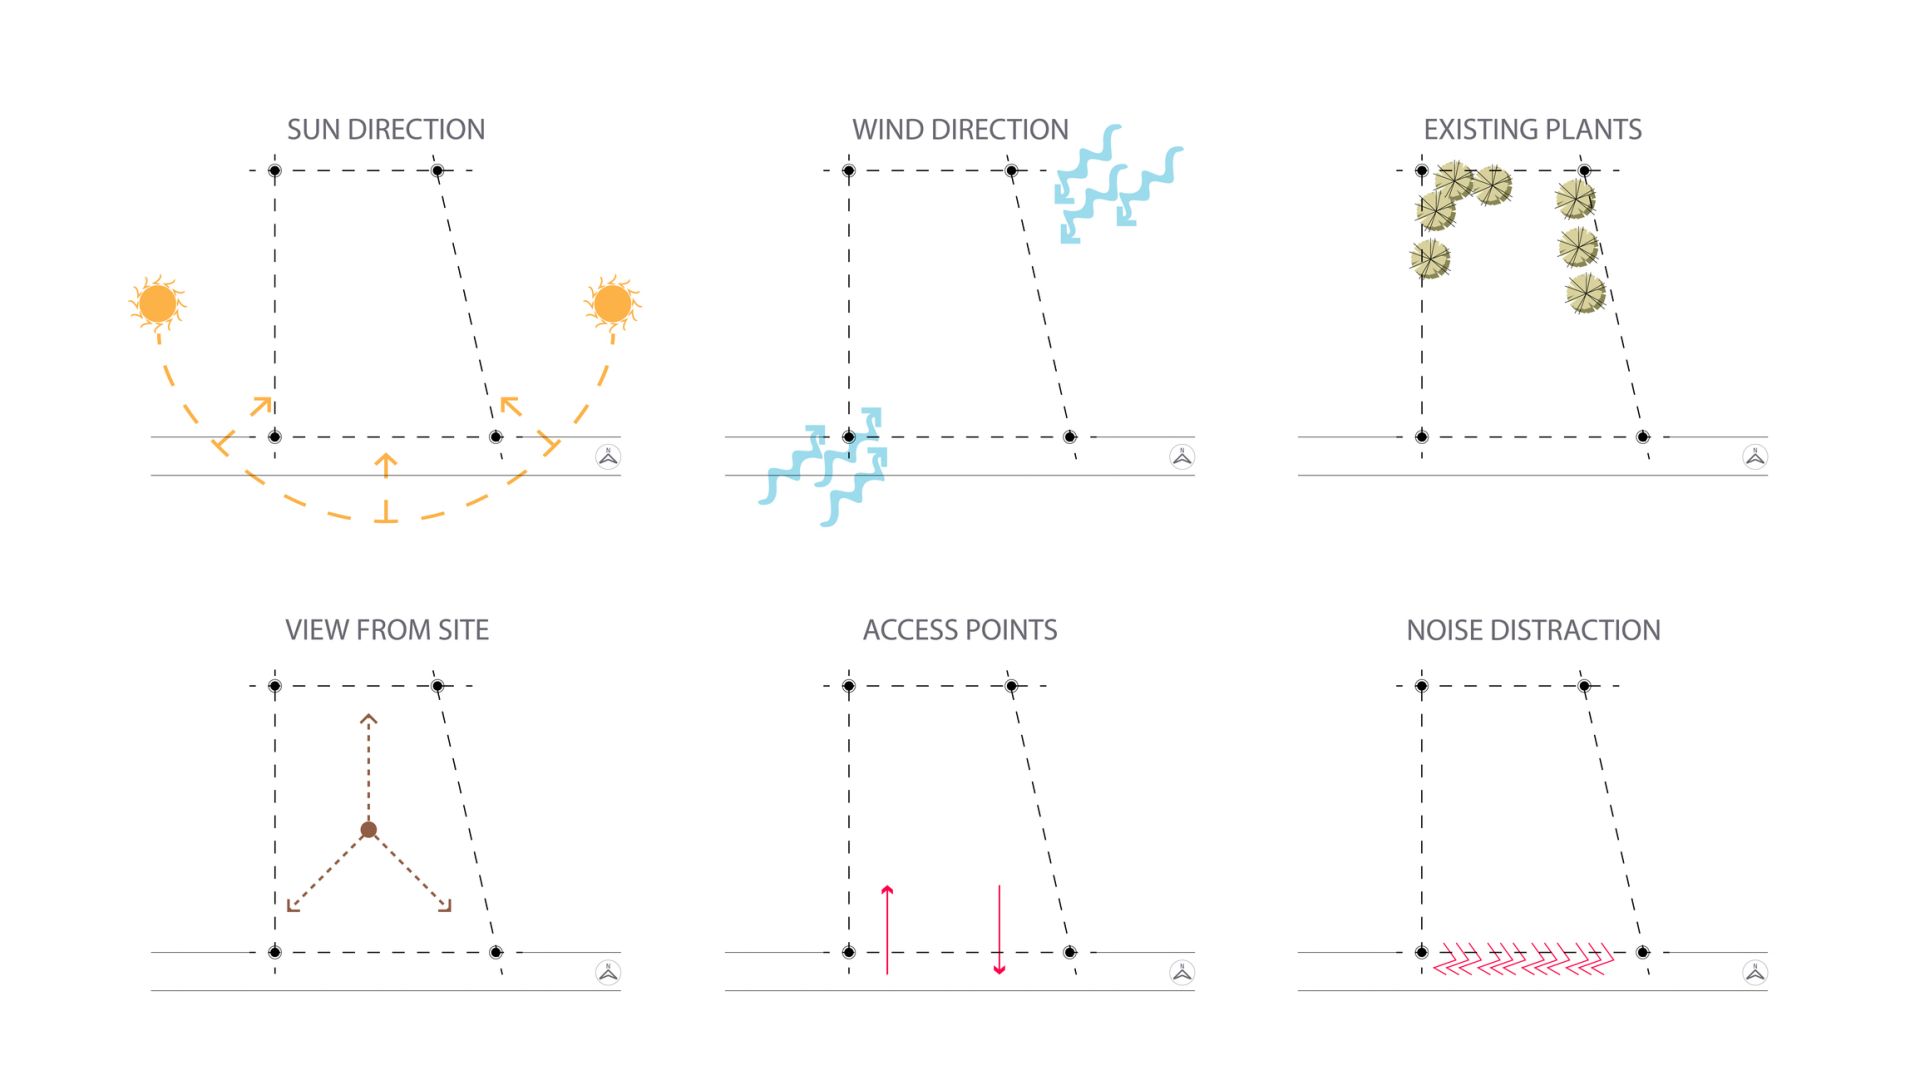
A typical site analysis diagram landscape study includes information such as solar exposure, wind direction, drainage patterns, slope, views, access points, and existing vegetation. These conditions are represented through clear graphic symbols that allow designers to read the site quickly. Arrows might indicate prevailing wind, shading may represent areas of shadow, and contour lines illustrate the slope of the land.
In architecture the same concept appears in early planning stages, which is why many designers also refer to site analysis diagram architecture methods. Both architecture and landscape architecture rely on this process because it allows designers to understand the behavior of a site before altering it. Without this step design decisions are often based on assumptions rather than real conditions.
Designers often create several site analysis diagrams rather than combining everything into one drawing. Each diagram studies a specific factor such as sunlight, drainage, or views. This approach allows environmental forces to be understood individually while still forming a complete landscape site analysis of the property.
Why Site Analysis Is Critical in Landscape Design
Landscape design must respond to environmental conditions that change over time. Sunlight moves across the site during the day, winds shift with seasonal weather patterns, and rainfall travels through the land according to slope and soil conditions. A landscape site analysis allows designers to understand these patterns before determining where outdoor spaces should be located.
Solar exposure is often the first condition studied during site analysis landscape design. Areas that receive strong afternoon sun may not be comfortable for outdoor seating unless shade structures or trees are introduced. On the other hand planting beds designed for flowering species may require consistent sunlight throughout the day. Understanding these conditions allows designers to position outdoor spaces appropriately.
Wind patterns also influence how a landscape feels. In open environments strong winds may affect outdoor comfort and plant performance. A landscape site analysis sun wind study often reveals areas that need protection from prevailing winds. These conditions may suggest the placement of hedges, walls, or other forms of wind protection.
Topography plays an equally important role. Slopes determine how water moves across the property and how people move through the landscape. A landscape analysis diagram example may highlight high points that offer views or low points that collect water during storms. These insights guide grading decisions and the placement of pathways or terraces.
Through this process the landscape site study reveals how environmental forces interact across the property. Designers use this information to create outdoor spaces that respond naturally to the site rather than imposing a design that conflicts with it.
Information to Include in a Landscape Site Analysis Diagram

A site analysis diagram landscape study typically documents environmental conditions that influence design decisions. While every project is different, most diagrams focus on a similar set of observations that help designers understand how a site behaves.
Sun Path and Solar Exposure
Sunlight patterns influence how outdoor spaces are used and how plants perform. Designers often map the path of the sun from east to west and identify areas of full sun, partial shade, and deep shade. This landscape site analysis sun wind study helps determine where patios, gardens, and outdoor rooms should be placed for comfort and plant health.
Prevailing Wind Patterns
Wind direction is often documented using arrows across the diagram. These arrows illustrate how air moves across the property and where strong winds may occur. Identifying prevailing winds allows designers to locate outdoor spaces in protected areas or introduce plantings and structures that reduce exposure.
Topography and Slope
Slope affects both circulation and drainage within a landscape. Designers typically document contour lines and highlight areas where the terrain rises or falls. Understanding these conditions helps determine whether retaining walls, terracing, or gentle grading adjustments will be necessary during the design process.
Drainage and Water Movement
Rainwater rarely stays in one place. Designers observe how water moves across the land during storms and identify low areas where water collects. These observations help guide strategies for stormwater management such as swales, permeable surfaces, and rain gardens.
Views and Adjacencies
Views influence how people experience a landscape. A landscape analysis diagram example may identify desirable views toward natural features or distant landscapes while also marking undesirable views that require screening. Nearby buildings, roads, or neighboring properties are also considered as part of this visual study.
Landscape Site Analysis Diagram Example
A landscape analysis diagram example usually emphasizes graphic clarity rather than detailed construction information. Designers rely on simple visual elements such as arrows, shading, and annotations to communicate environmental conditions. The goal is to allow viewers to understand the site quickly without reading long explanations.
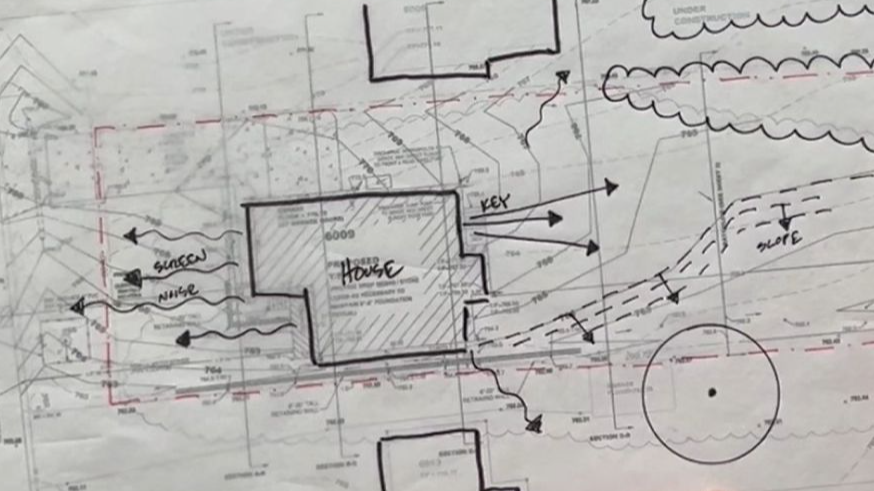
For example arrows may illustrate prevailing wind patterns across the property while curved lines represent the path of the sun during the day. Shaded areas might show zones of shadow created by existing trees or buildings. Contour lines can reveal how the ground slopes while directional arrows may indicate how stormwater flows across the site.
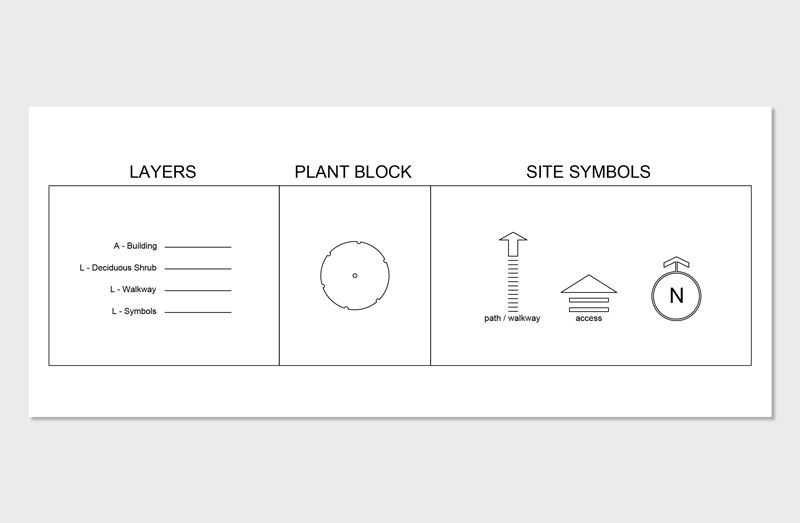
Most site analysis diagrams are created on top of a base drawing derived from a property survey. The base plan establishes the scale and boundaries of the site while the analysis graphics overlay environmental information. Designers often organize these graphics into layers so that each environmental factor can be studied independently.
This approach is common in both landscape architecture and architecture site analysis diagrams because it allows designers to clearly understand environmental relationships before moving forward with design proposals. The simplicity of these graphics makes them effective communication tools when presenting early ideas to clients or collaborators.
For example arrows may illustrate prevailing wind patterns across the property while curved lines represent the path of the sun during the day. Shaded areas might show zones of shadow created by existing trees or buildings. Contour lines can reveal how the ground slopes while directional arrows may indicate how stormwater flows across the site.
Most site analysis diagrams are created on top of a base drawing derived from a property survey. The base plan establishes the scale and boundaries of the site while the analysis graphics overlay environmental information. Designers often organize these graphics into layers so that each environmental factor can be studied independently.
This approach is common in both landscape architecture and architecture site analysis diagrams because it allows designers to clearly understand environmental relationships before moving forward with design proposals. The simplicity of these graphics makes them effective communication tools when presenting early ideas to clients or collaborators.
How to Do a Site Analysis for Landscape Design
Learning how to do a site analysis involves documenting environmental conditions and translating those observations into diagrams that reveal patterns across the site. Designers typically follow a process that combines research, field observation, and drawing.
Step 1: Collect Base Site Information
Begin by gathering information about the property.
This base information forms the foundation for your landscape site study.
- Obtain a property survey or base plan
- Review aerial imagery or satellite maps
- Identify property boundaries and existing structures
- Locate any available topographic information
This base information forms the foundation for your landscape site study.
Step 2: Visit the Site and Observe Conditions
Walking the site provides insight that drawings alone cannot reveal.
These observations provide valuable insight for landscape site analysis.
- Observe sunlight patterns throughout the day
- Identify prevailing wind direction
- Document existing vegetation and canopy cover
- Notice areas where water collects after rainfall
- Record views both toward and away from the property
These observations provide valuable insight for landscape site analysis.
Step 3: Identify Environmental Patterns
After documenting conditions, begin identifying patterns.
These patterns reveal opportunities and constraints that will influence the design.
- Map areas of sun and shade
- Identify slopes and elevation changes
- Trace how water flows across the site
- Mark desirable and undesirable views
These patterns reveal opportunities and constraints that will influence the design.
Step 4: Translate Observations into Diagrams
Once patterns are understood, convert them into a site analysis diagram.
The goal is to communicate information clearly rather than create complex drawings
- Use arrows to represent wind direction or water movement
- Use shading to illustrate sunlight and shadow
- Use contour lines to show slope and terrain
- Clearly label environmental conditions
The goal is to communicate information clearly rather than create complex drawings
Creating a Site Analysis Diagram in AutoCAD
Many landscape designers create analysis diagrams digitally so the information can be organized into layers and reused throughout the design process. AutoCAD is commonly used for this purpose because it allows designers to work accurately at scale while maintaining flexible graphic control.
The process usually begins by importing a survey or base plan into AutoCAD. Designers then create layers that represent different environmental conditions identified during landscape site analysis. One layer may show arrows representing wind direction while another illustrates solar exposure or shaded areas created by existing trees. Additional layers may represent drainage flow, views, or slopes.
Organizing diagrams into layers allows designers to study each environmental factor independently while still maintaining a clear connection to the base plan. These diagrams can later be combined or exported as presentation graphics during concept development.
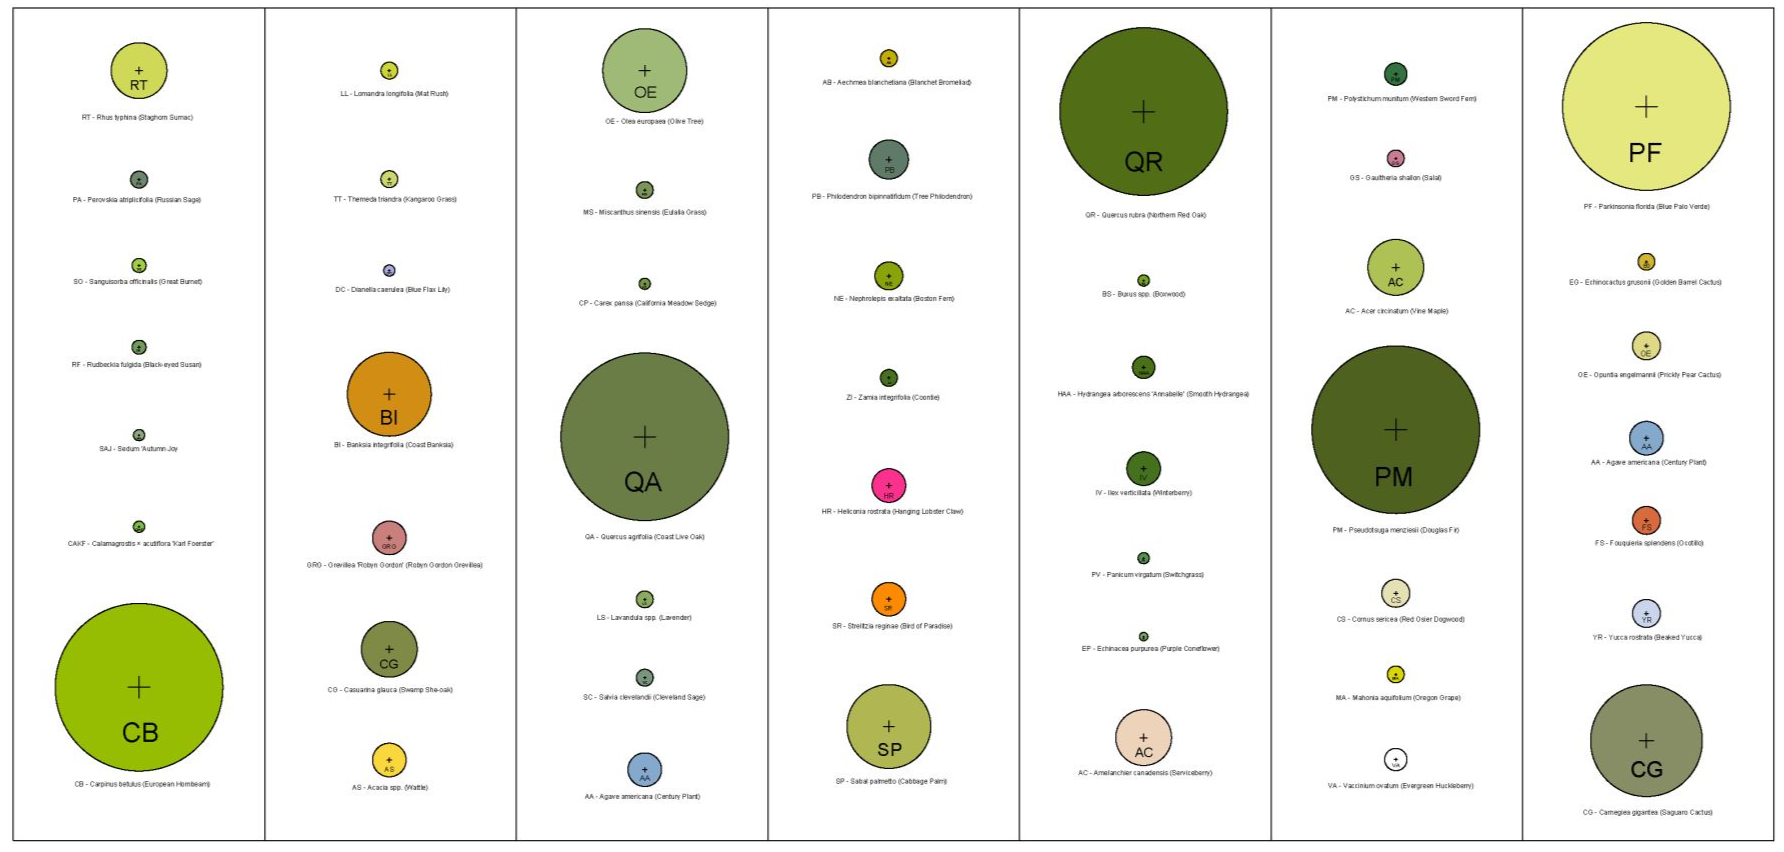
Many designers build their own libraries of diagrammatic symbols for AutoCAD such as arrows, shading patterns, and icons used during site analysis landscape architecture work. These symbols help create clear visual language and speed up the documentation process across multiple projects.
If you want to learn the full drafting workflow landscape designers use to produce plans and diagrams digitally, this process is explored in depth inside the AutoCAD for Landscape Design course.
The process usually begins by importing a survey or base plan into AutoCAD. Designers then create layers that represent different environmental conditions identified during landscape site analysis. One layer may show arrows representing wind direction while another illustrates solar exposure or shaded areas created by existing trees. Additional layers may represent drainage flow, views, or slopes.
Organizing diagrams into layers allows designers to study each environmental factor independently while still maintaining a clear connection to the base plan. These diagrams can later be combined or exported as presentation graphics during concept development.
Many designers build their own libraries of diagrammatic symbols for AutoCAD such as arrows, shading patterns, and icons used during site analysis landscape architecture work. These symbols help create clear visual language and speed up the documentation process across multiple projects.
If you want to learn the full drafting workflow landscape designers use to produce plans and diagrams digitally, this process is explored in depth inside the AutoCAD for Landscape Design course.
Creating Site Analysis Diagrams in Rhino
Rhino is another tool sometimes used during landscape site analysis, especially when designers want to explore spatial relationships in three dimensions. While AutoCAD is typically used for drafting, Rhino allows designers to model terrain and study how sunlight interacts with the landscape.
Using Rhino designers can generate terrain models from contour data and simulate the movement of sunlight across the site. This helps reveal how buildings, slopes, and vegetation influence shadow patterns throughout the day. For projects where solar exposure plays a major role in comfort or planting design this type of analysis can be extremely valuable.
Rhino also allows designers to explore how proposed landscape elements interact with existing topography. Terraces, retaining walls, and pathways can be tested quickly within the terrain model. This approach connects landscape site analysis directly with early conceptual design exploration.
Many designers begin with analysis diagrams in AutoCAD and later transition to Rhino as the project develops into three dimensional design studies.
Downloadable Resource
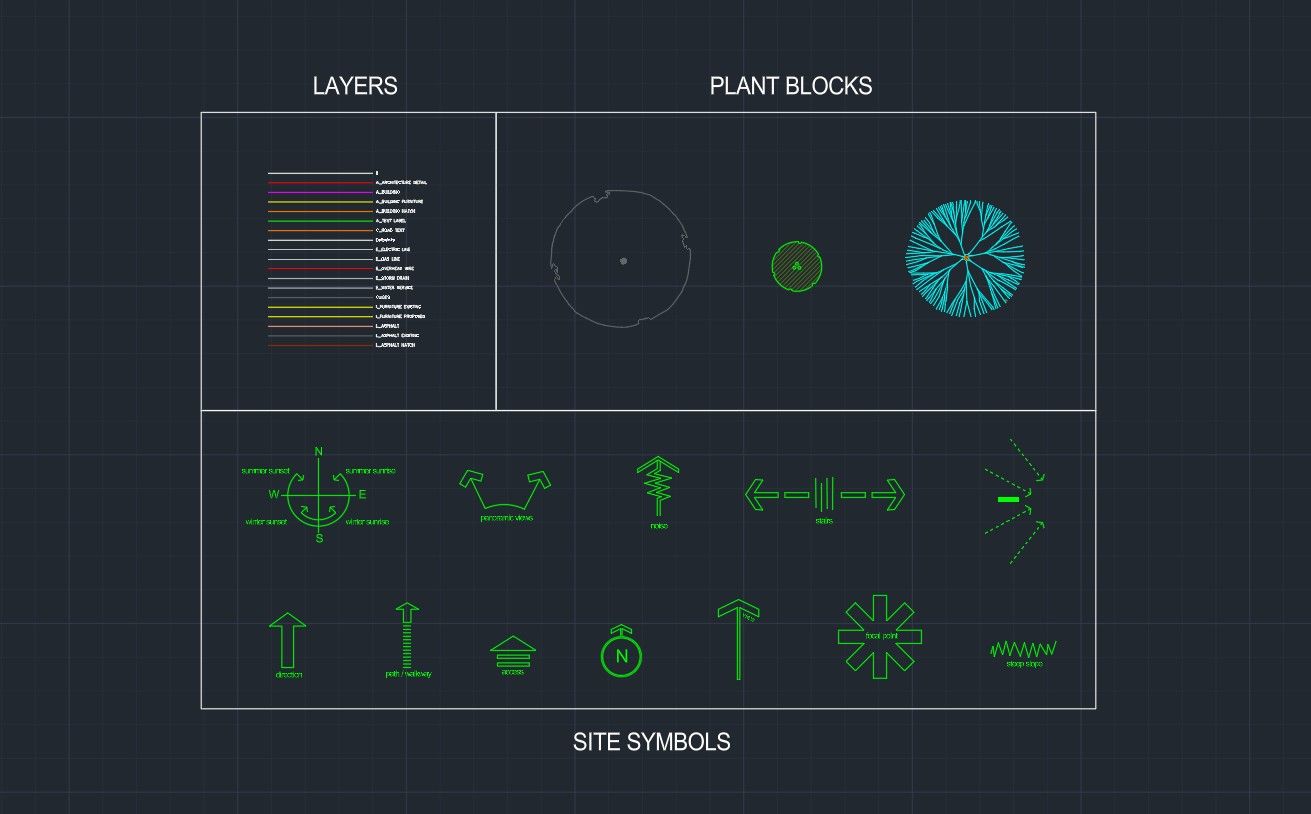
If you want to start creating diagrams immediately you can download the AutoCAD Starter Pack which includes diagrammatic symbols used for site analysis drawings. The resource includes arrows, graphic markers, and layout elements that help communicate environmental conditions clearly within a drawing.
These symbols are commonly used during site analysis landscape architecture work and help designers produce diagrams quickly without building graphics from scratch. By starting with a ready made symbol library you can focus on analyzing the site rather than constructing graphic elements.
The AutoCAD Starter Pack also introduces the layer organization and drafting workflow used throughout the AutoCAD for Landscape Design training. Many designers begin with this resource when learning how professional landscape drawings and diagrams are developed.
Common Mistakes When Creating Site Analysis Diagrams
One common mistake in landscape site analysis is attempting to include too much information within a single drawing. When multiple environmental factors are layered together without organization the diagram becomes difficult to read. Designers often create separate site analysis diagrams that study individual conditions such as sunlight, wind, or drainage.
Another mistake is using symbols that are visually inconsistent. A clear diagram relies on simple graphics that communicate information quickly. When symbols become overly complicated the drawing loses clarity and becomes harder to interpret.
Some designers also overlook seasonal variation. Sun angles, vegetation density, and drainage conditions can change dramatically throughout the year. A thorough landscape site study considers how environmental conditions evolve across different seasons rather than relying on observations from a single moment.
Finally diagrams should always remain connected to the base site plan. Without accurate scale and spatial context it becomes difficult to translate analysis insights into design decisions.
How Site Analysis Leads to Better Landscape Design
A well prepared site analysis diagram does more than document environmental conditions. It becomes a guide that shapes design thinking throughout the project. By understanding how sunlight moves across the property designers can place outdoor spaces where they remain comfortable during different times of day. Wind analysis helps identify areas that require shelter while slopes may suggest opportunities for terraces or viewpoints.
Drainage patterns discovered during landscape site analysis influence grading strategies and stormwater management. Rather than resisting the natural flow of water designers can incorporate swales, rain gardens, and permeable surfaces that work with the land. These solutions often create landscapes that are more resilient and easier to maintain.
Views identified during the landscape site study also shape the experience of the space. Seating areas may be positioned to frame distant scenery while plantings may be used to screen nearby buildings or roads.
Through this process the site analysis diagram becomes the bridge between observation and design. It ensures that every element introduced into the landscape responds thoughtfully to the conditions of the site.

The Landscape Library Academy is an online platform teaching landscape professionals, students, homeowners and enthusiasts how to design landscapes and master software for the field.
The Landscape Library Academy is the education division of The Landscape Library.
Click here to visit TheLandscapeLibrary.com for media including education articles, projects features and more.
The Landscape Library Academy is the education division of The Landscape Library.
Click here to visit TheLandscapeLibrary.com for media including education articles, projects features and more.
Company
Learn
Copyright © 2025